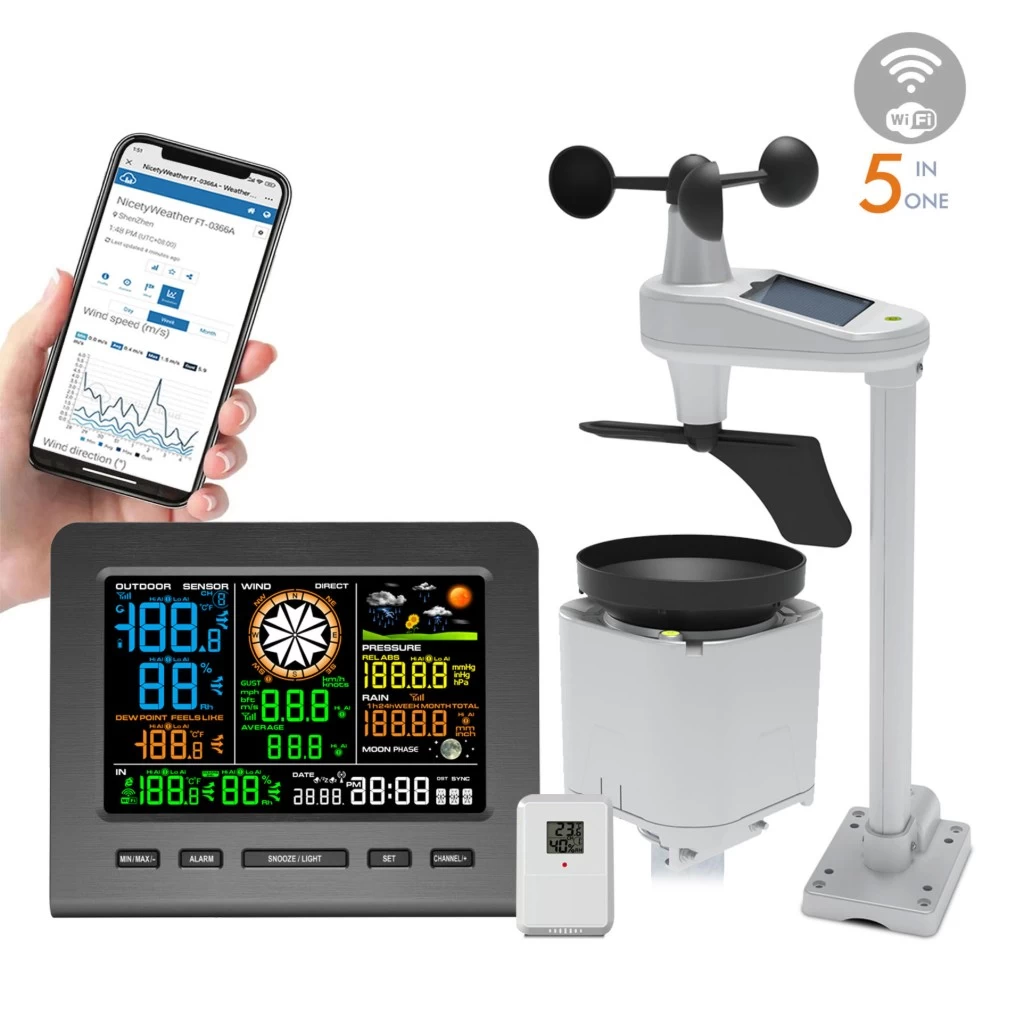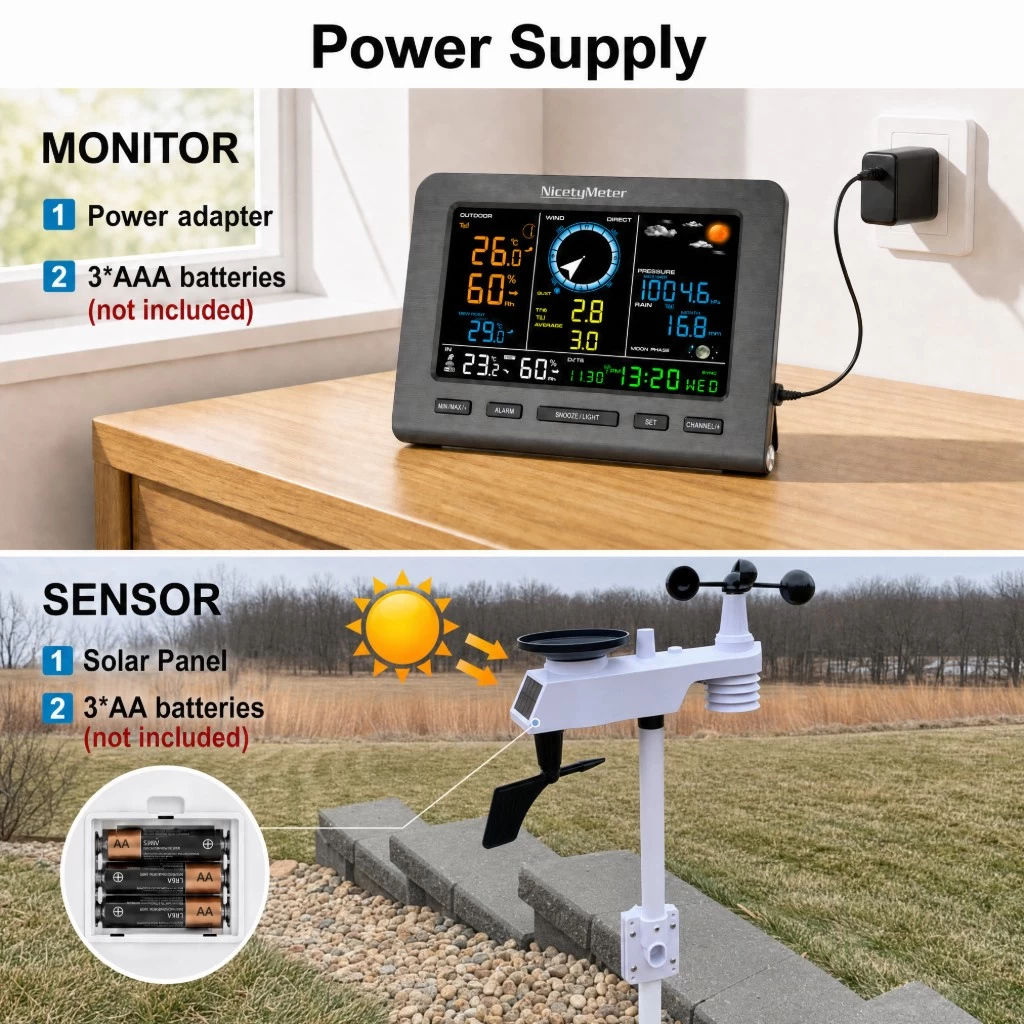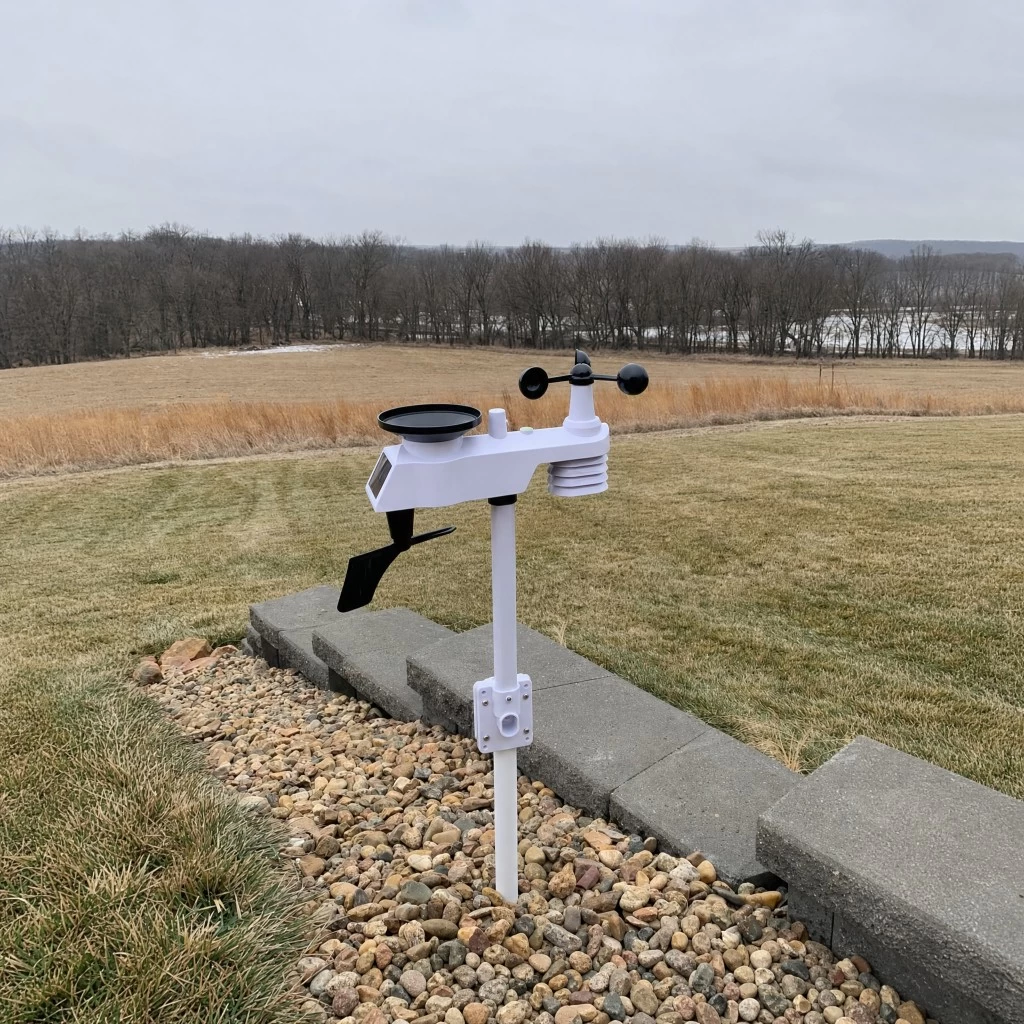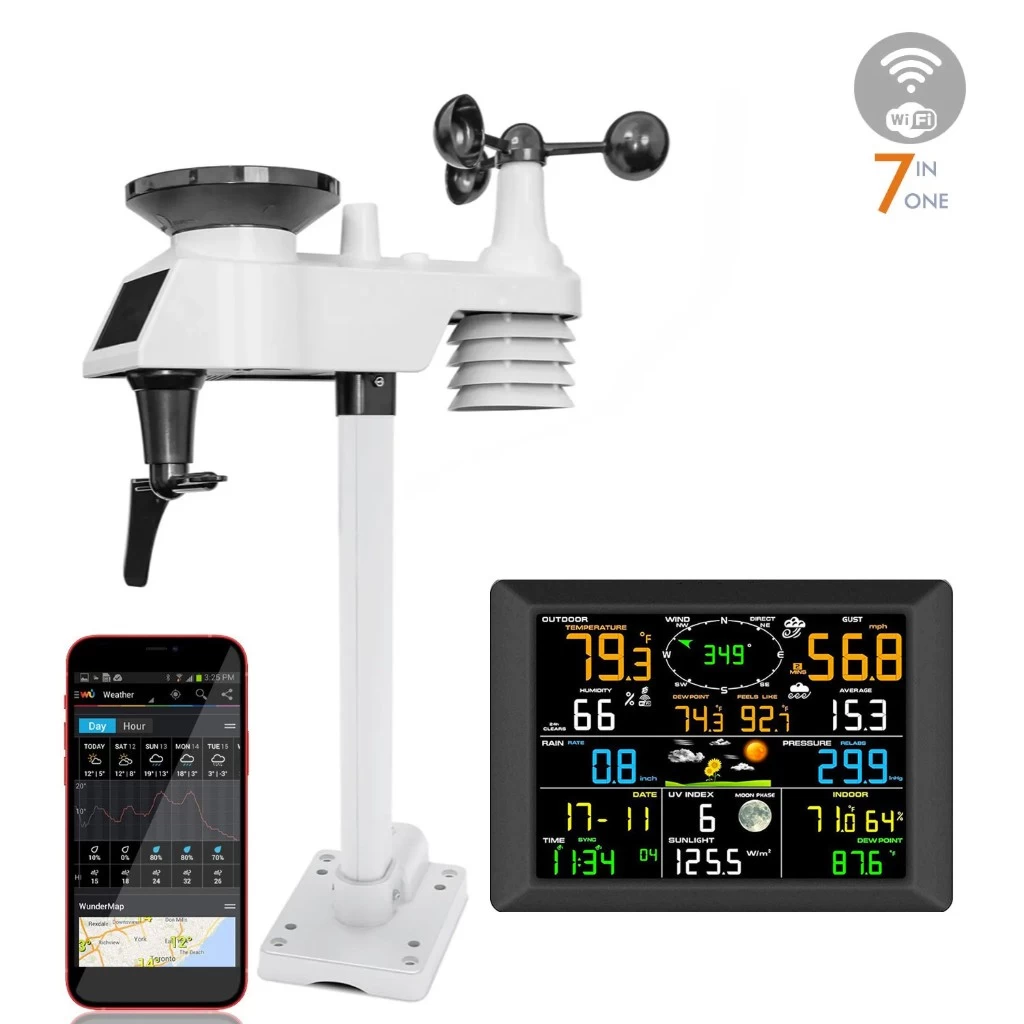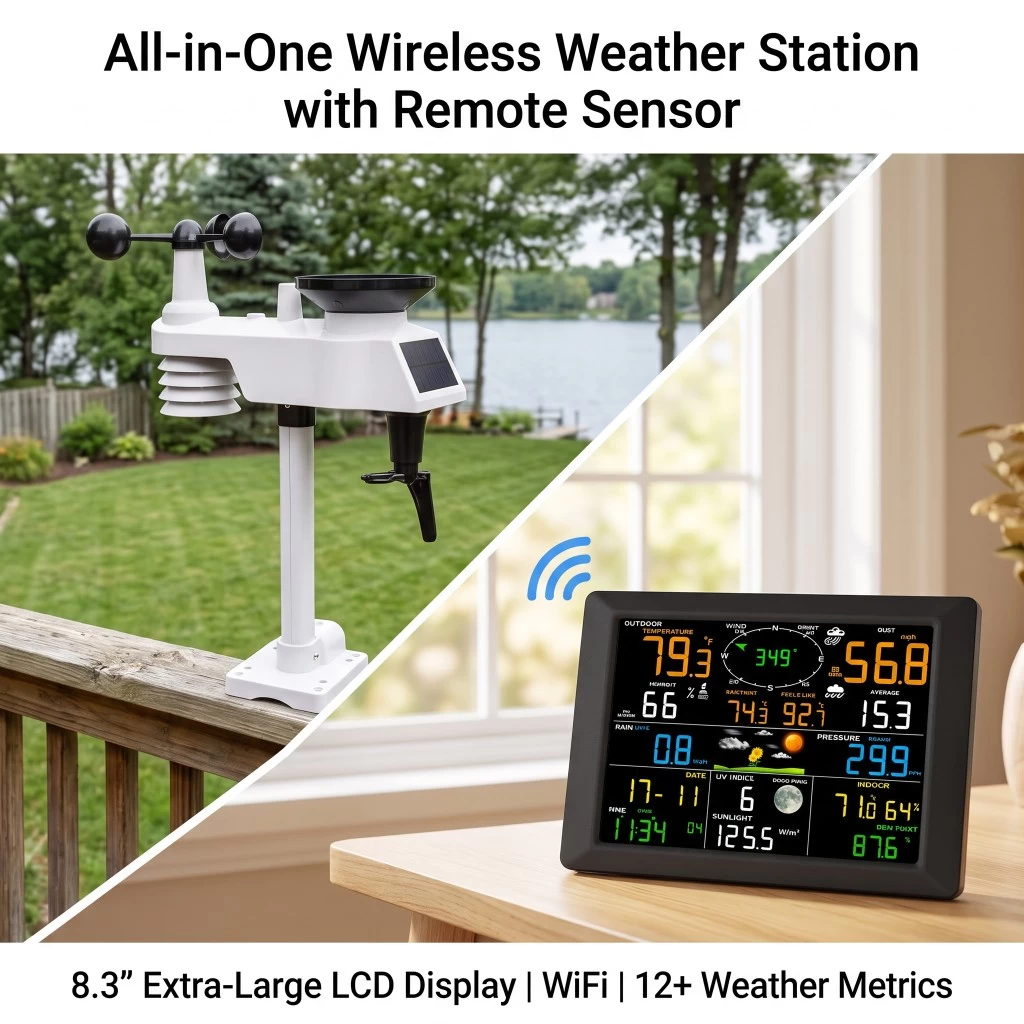
You connected the station to WiFi, opened the platform, saw the current temperature, and closed the tab. That is where most owners stop — and it is where most of the value is still sitting unused.
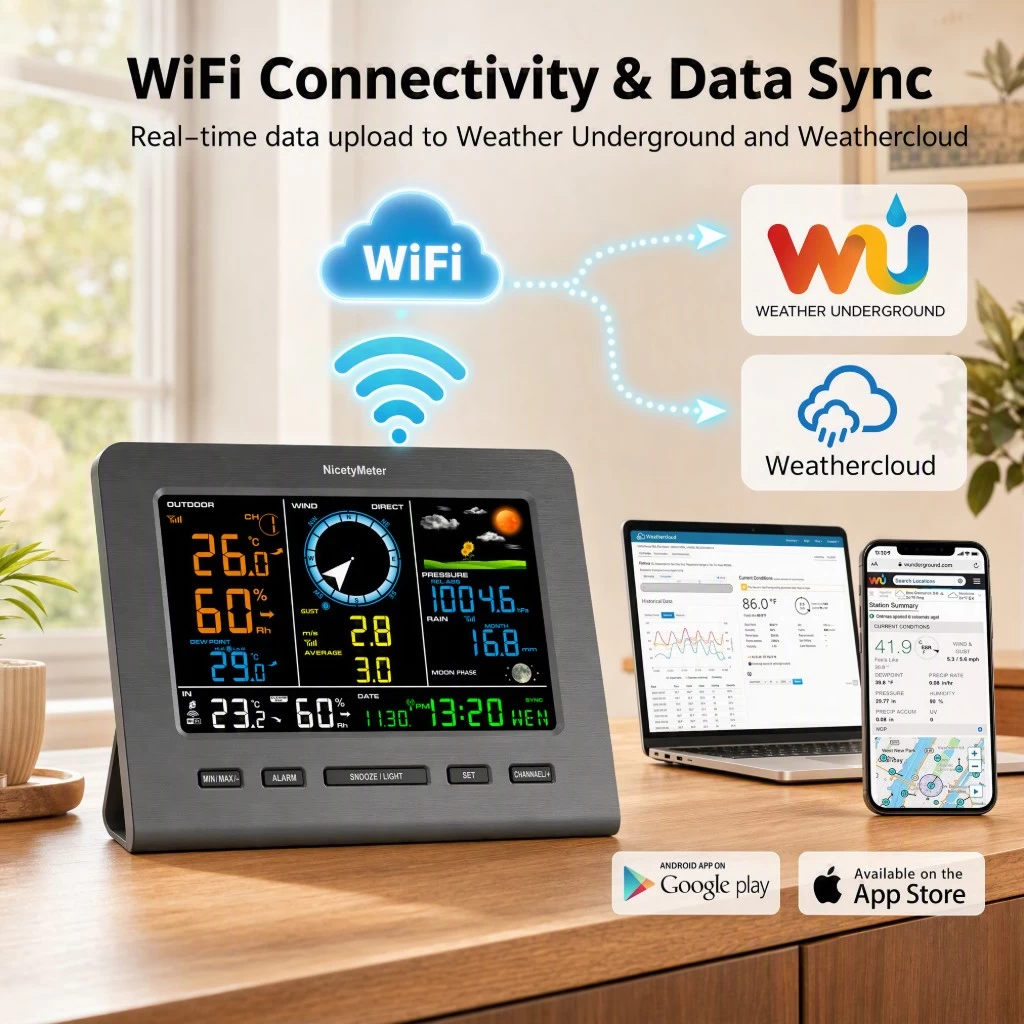
A weather station's real output is not the number on the dashboard. It is the record: what happened at 3 am, how much rain fell this week, how long the leaves stayed wet. That record lives in Weather Underground and WeatherCloud, and it is free to use once the upload is running.
Step one: confirm the upload is actually working
Before reading anything into the numbers, check three things. A station that stopped uploading three days ago still shows a temperature — it is just an old one.
- Last update time. Both platforms show when your station last reported. If it is more than a few minutes old, the console has lost WiFi or the upload is paused.
- Station visibility. If the station is set to private, the history pages stay empty. Make it public if you want shareable links.
- Console clock. A console with the wrong date or timezone will upload correct values under wrong timestamps, and every chart afterwards will be hard to trust.
Step two: where the history actually is
Both platforms keep daily, weekly and monthly summaries, and both will plot the parameters your station sends. What you are looking for is not the live gauge but the summary for the period you care about.
| Weather Underground | WeatherCloud | |
|---|---|---|
| Best for | Long public record, easy to share, widely recognised | Cleaner graphs, quick side-by-side comparison |
| History view | Daily / weekly / monthly summaries plus per-parameter charts | Charts per parameter with selectable period |
| Data export | Available from the station data pages | Available from the data view |
| Who sees it | Anyone with the station link | Anyone with the station link |
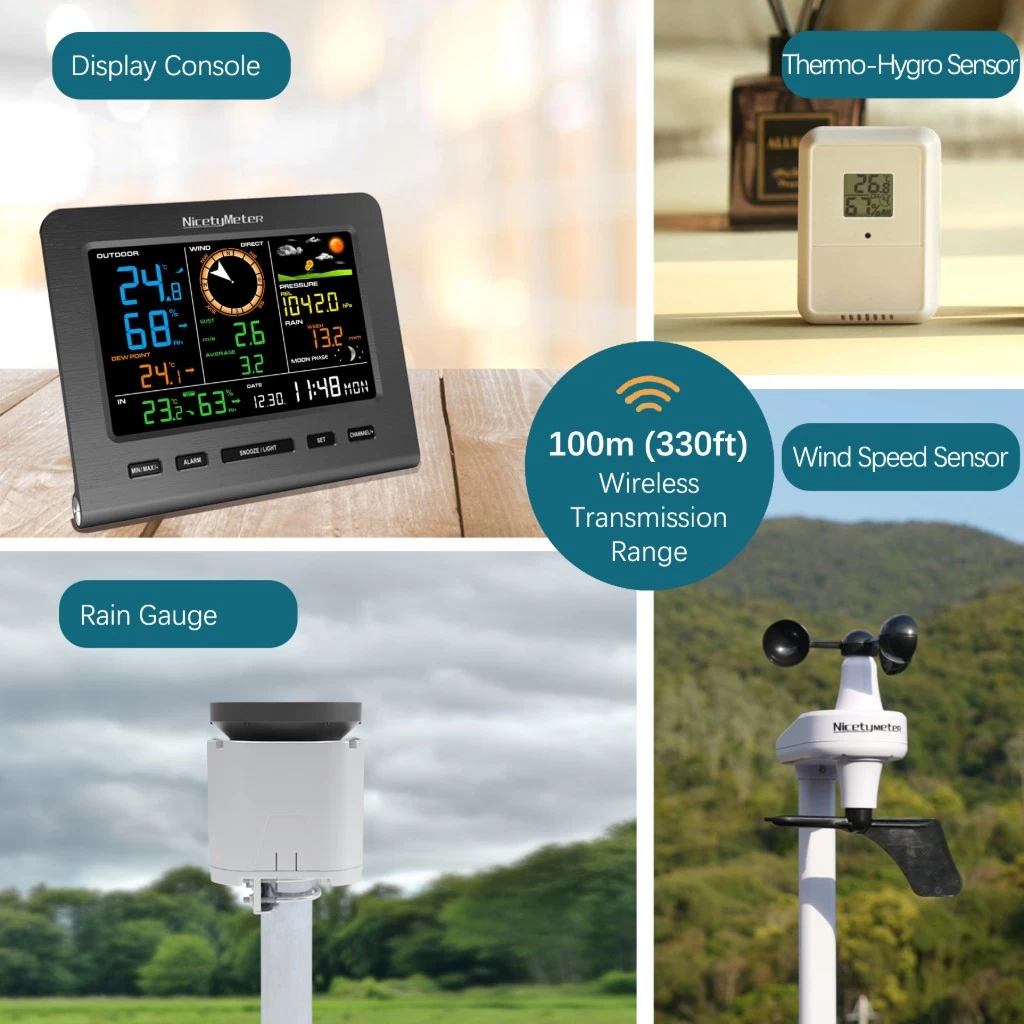
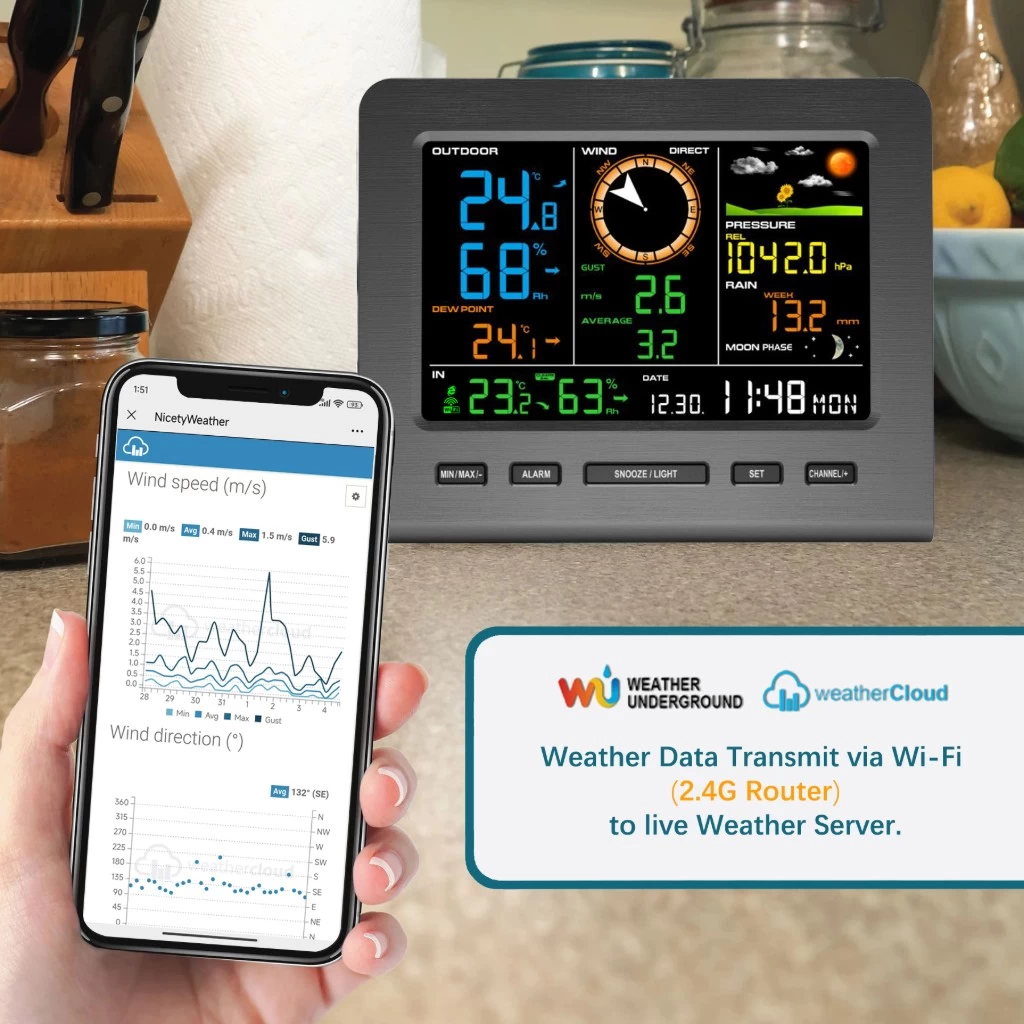
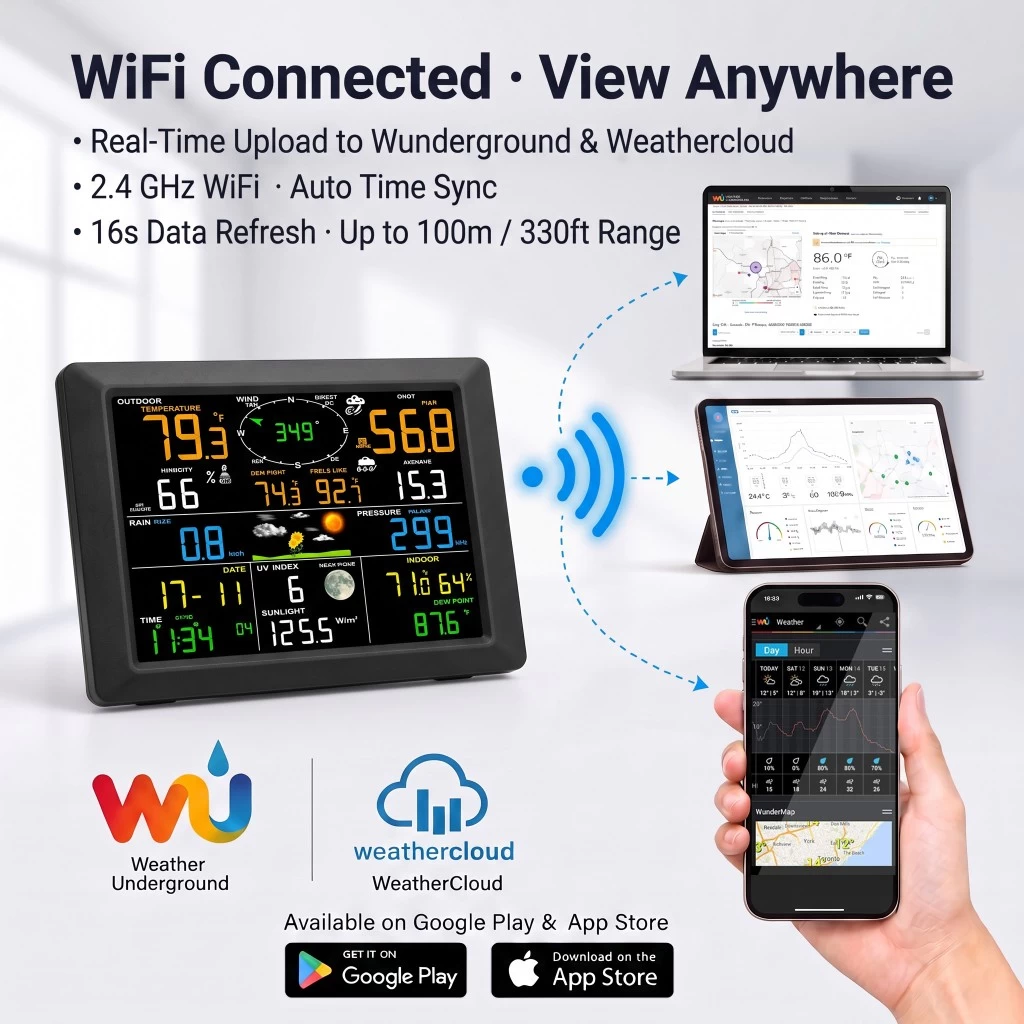
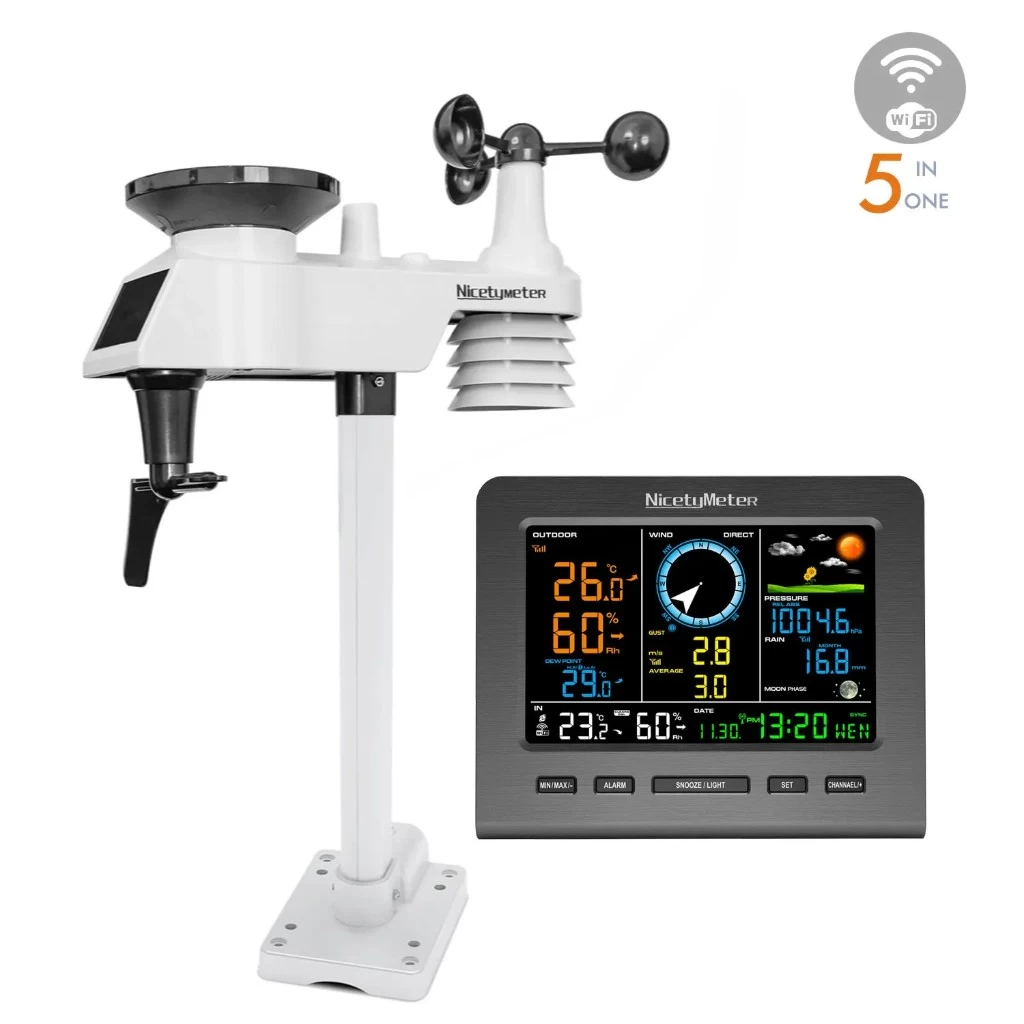
One practical note: our WiFi models upload to Weather Underground and WeatherCloud, and the models advertised with dual-platform upload send to both at once. Use whichever interface you find easier and treat the other as a second copy of the record.
Step three: send the link to someone who needs it
Both platforms give your station a permanent public address. That single link solves several problems at once:
- Give it to a farm manager or staff so they check conditions before driving out.
- Send it to a customer or supplier who wants proof of local conditions.
- Keep it on your phone's home screen — it opens faster than any app install.
Four readings that actually change a decision
This is the part worth learning. Each of these uses the record, not the live value.
1. Overnight minimum — for frost
Frost decisions are made on the night's low, not on the reading at 6 pm. Look at the minimum from the last few nights and how fast the temperature fell after sunset. A steep drop into the early hours is the pattern that catches people out; a slow drift usually does not.
2. Rainfall totals — for irrigation
A single rain event tells you little. The weekly and monthly totals tell you whether the soil has been refilled or whether you have been irrigating ground that was already wet. This is the number that saves water and pumping cost.
3. Wind speed window — for spraying
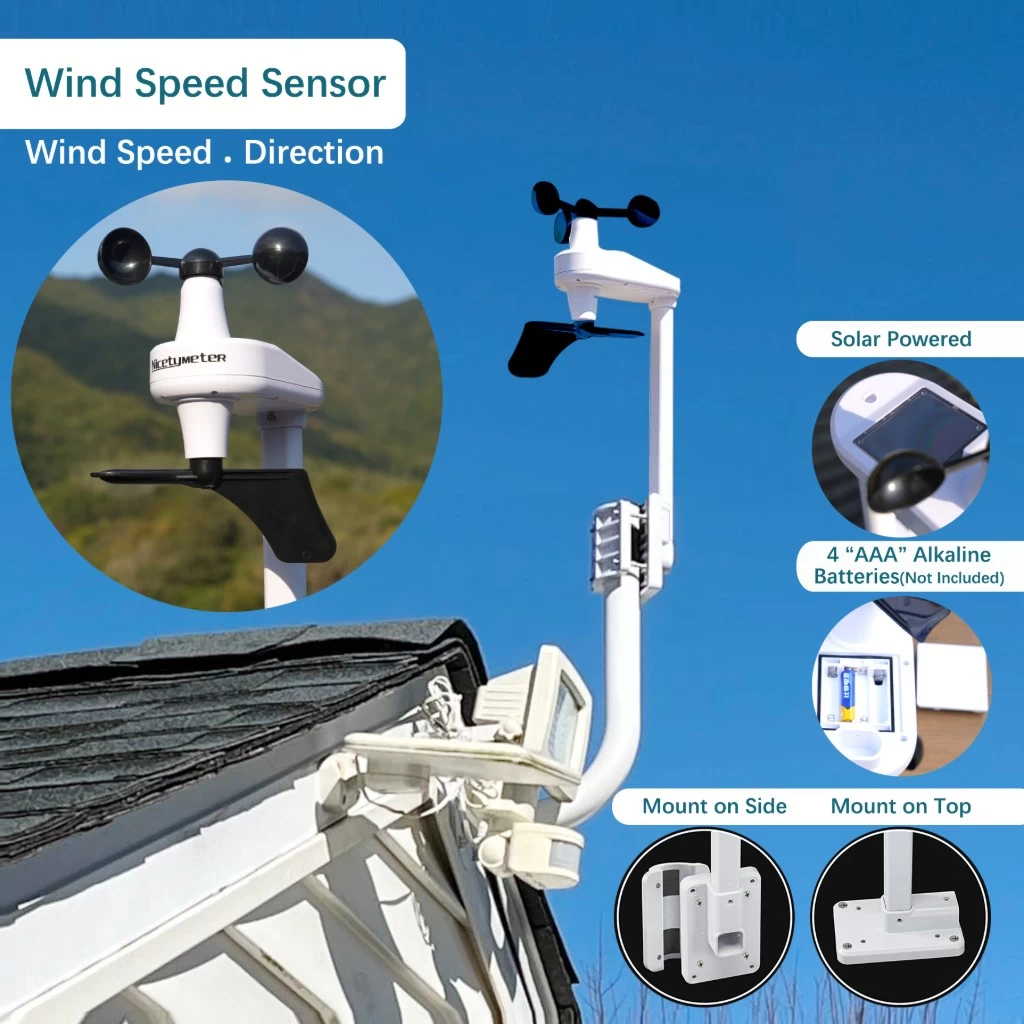
Spraying in the wrong wind is wasted chemical and possible drift damage. Check the wind chart for the calm window rather than guessing from how it feels at the house — the field is often windier than the garden.
4. Hours of high humidity — for disease risk
Leaf and fruit diseases care about how long surfaces stay wet, not about one humid afternoon. A run of hours above roughly 90% relative humidity overnight is the signal worth watching; a single spike is not.
The habit that pays off: check the summary once a week, not the live reading ten times a day. The weekly view is where patterns show up.
When something looks wrong
- Values stop updating but the console looks fine — the console has lost the WiFi network, usually after a router restart. Reconnect it; the historical gap cannot be filled.
- Timestamps are shifted by hours — console timezone setting, not the platform.
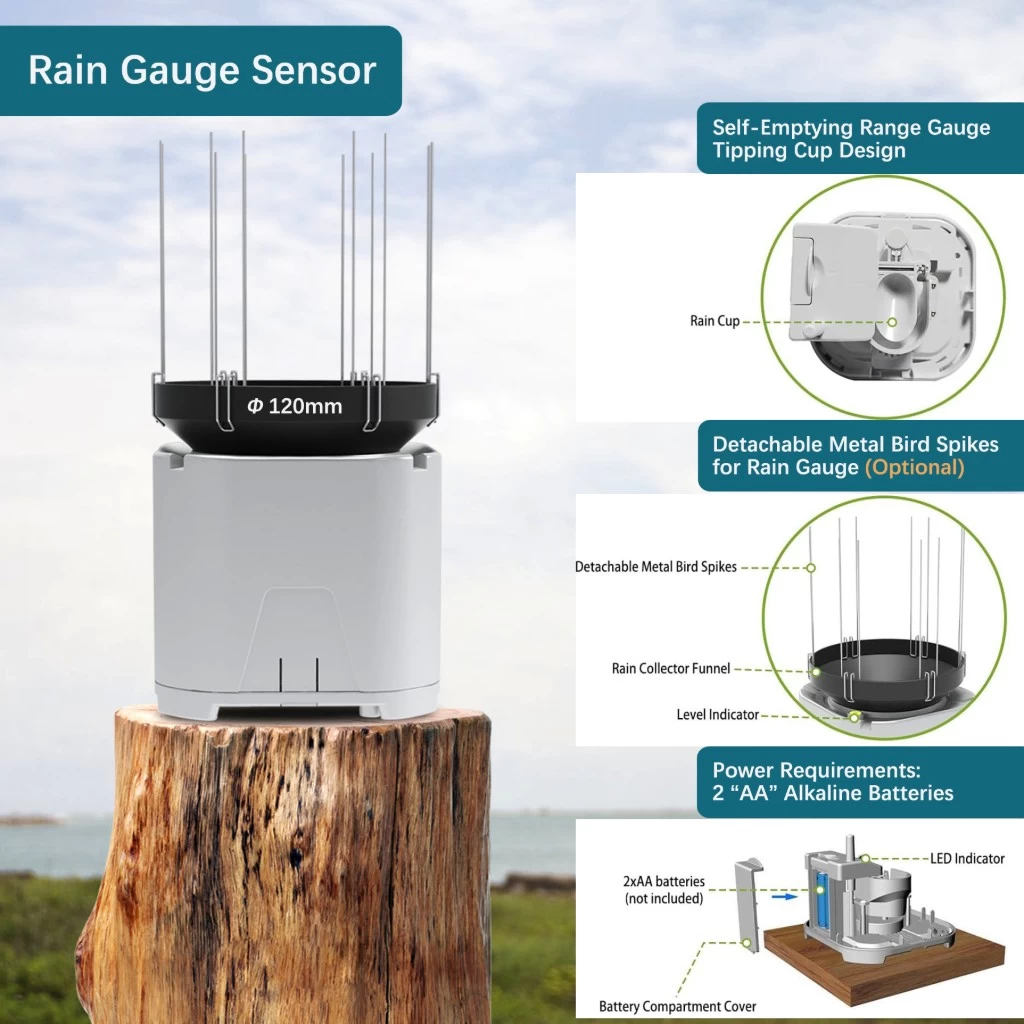
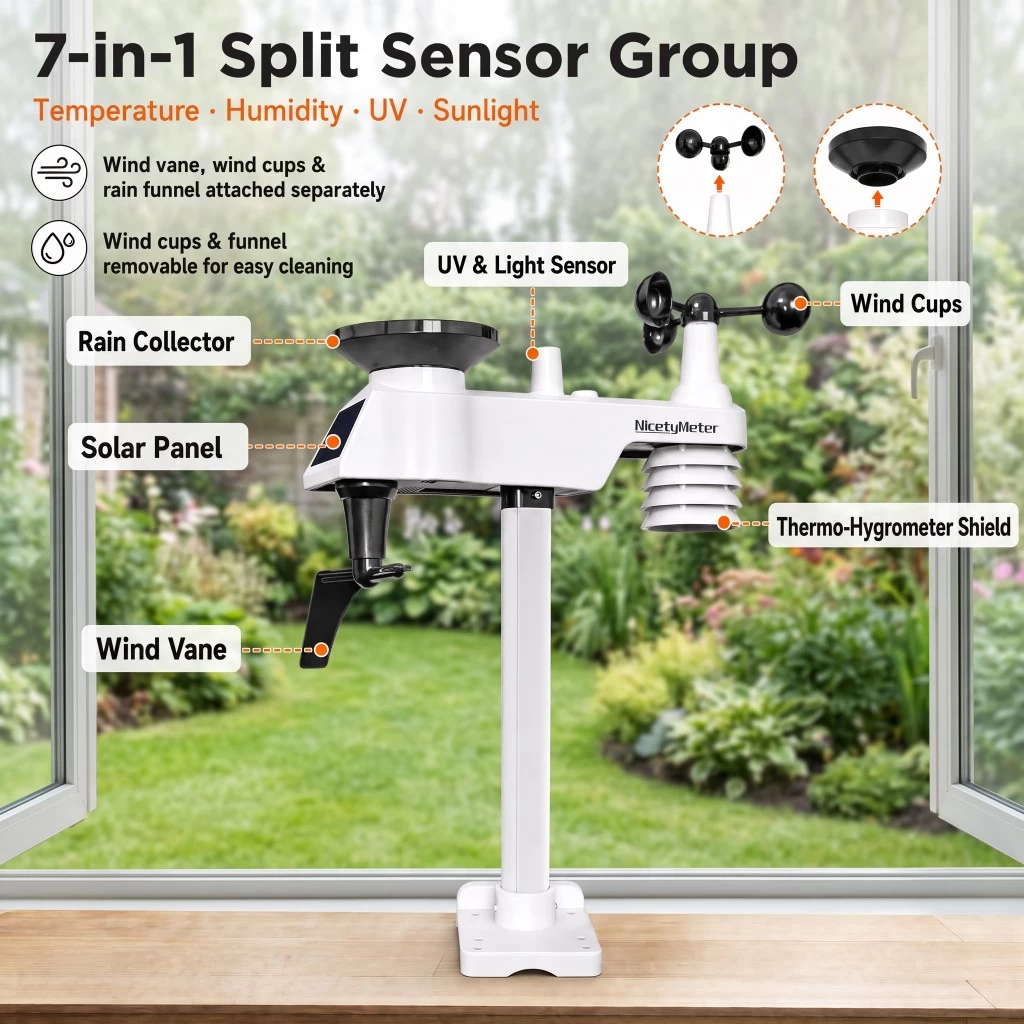
- Rain reads zero while it is clearly raining — check the funnel for leaves or debris before assuming a fault.
- Two platforms disagree slightly — normal, they round and display differently. Compare trends, not last digits.
FAQ
Do I need an account on both platforms?
Yes, one free account on each. The console is configured with your station ID and key for each platform, and uploads to both at once.
Can I see the data on my phone?
Yes — open the platform in your phone browser and add it to your home screen. The station's public link works the same way for anyone you share it with.
How much history is kept?
Both platforms keep a running record for public stations, which is why they are worth using alongside the console rather than instead of it.
What if I have no WiFi at the site?
Then cloud upload is not possible on any WiFi model. For offline sites, see the three off-grid options — the FT0345 keeps a local record without any network.
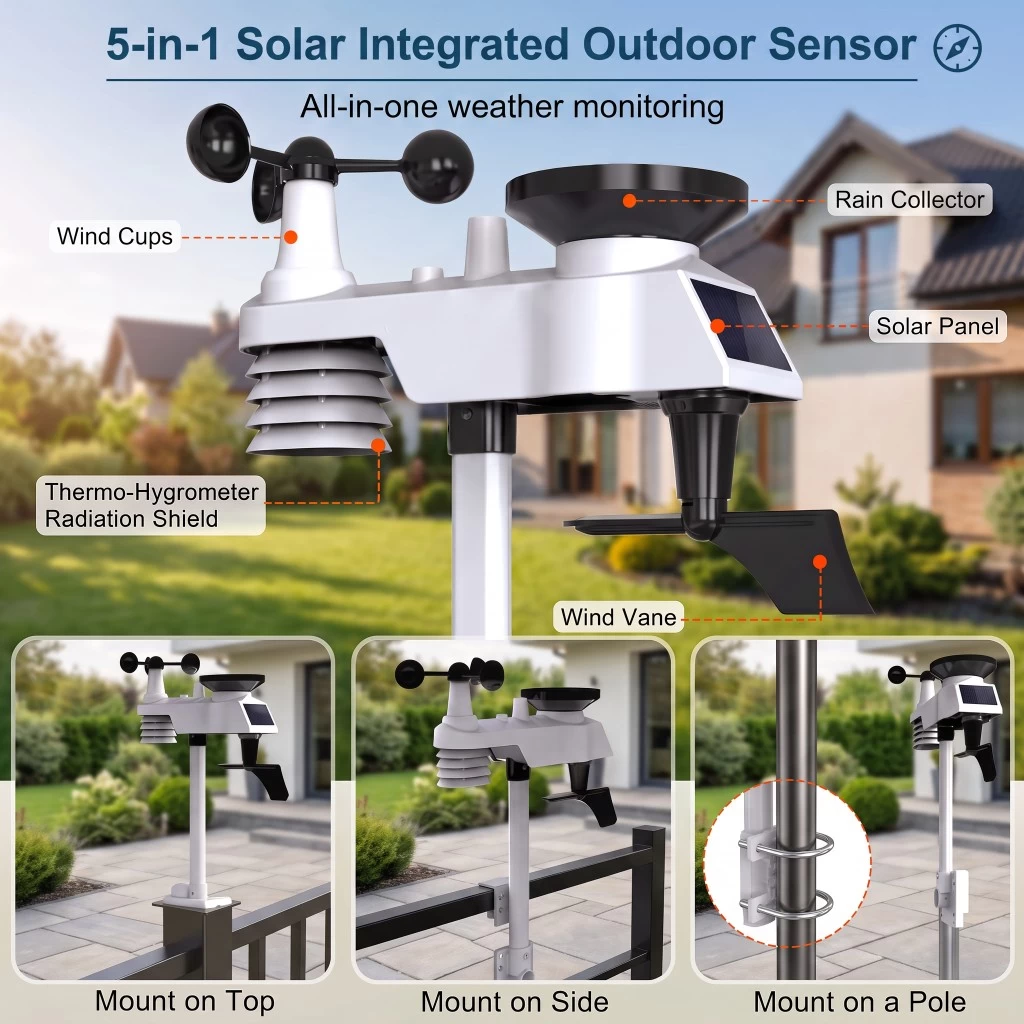
Related: running a station with no WiFi, and where to mount the outdoor sensor — a badly sited sensor produces a beautifully recorded set of wrong numbers.